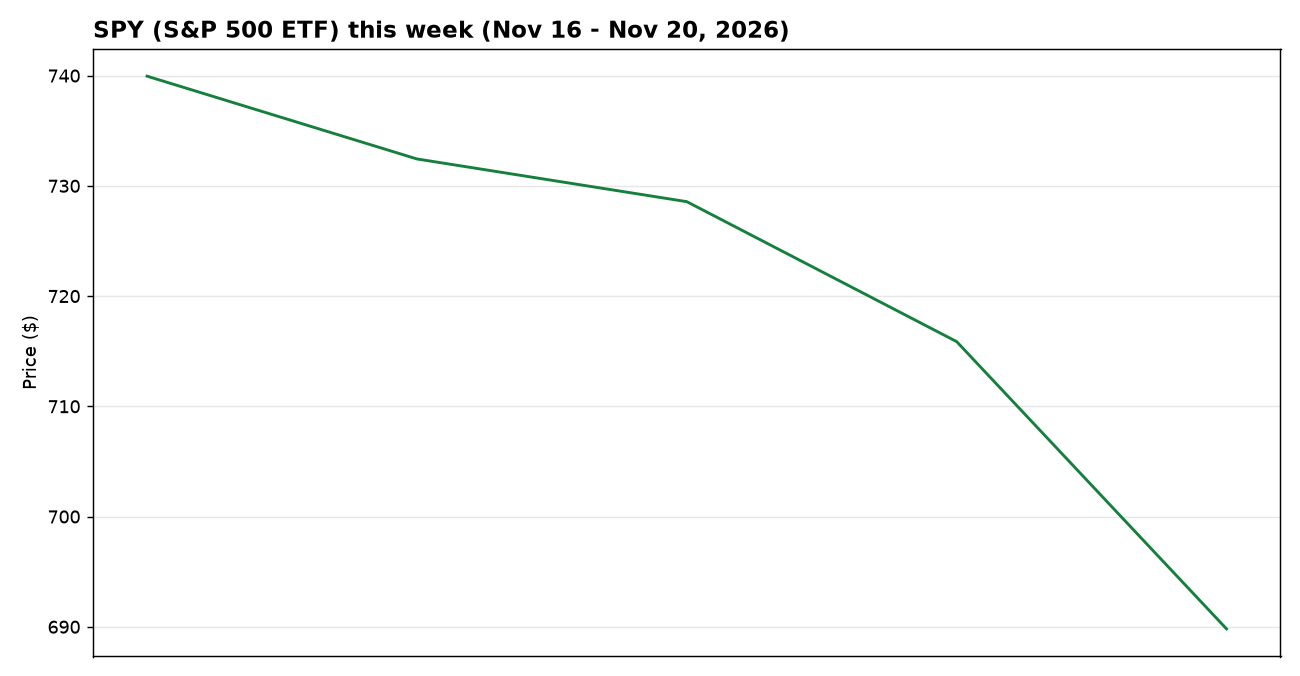
The Week in Numbers: S&P 500 -6.8% (November 16–November 20, 2026) November 22, 2026 by papagong S&P 500 -6.8% this week, year to date -11.3%, and the week’s biggest movers.
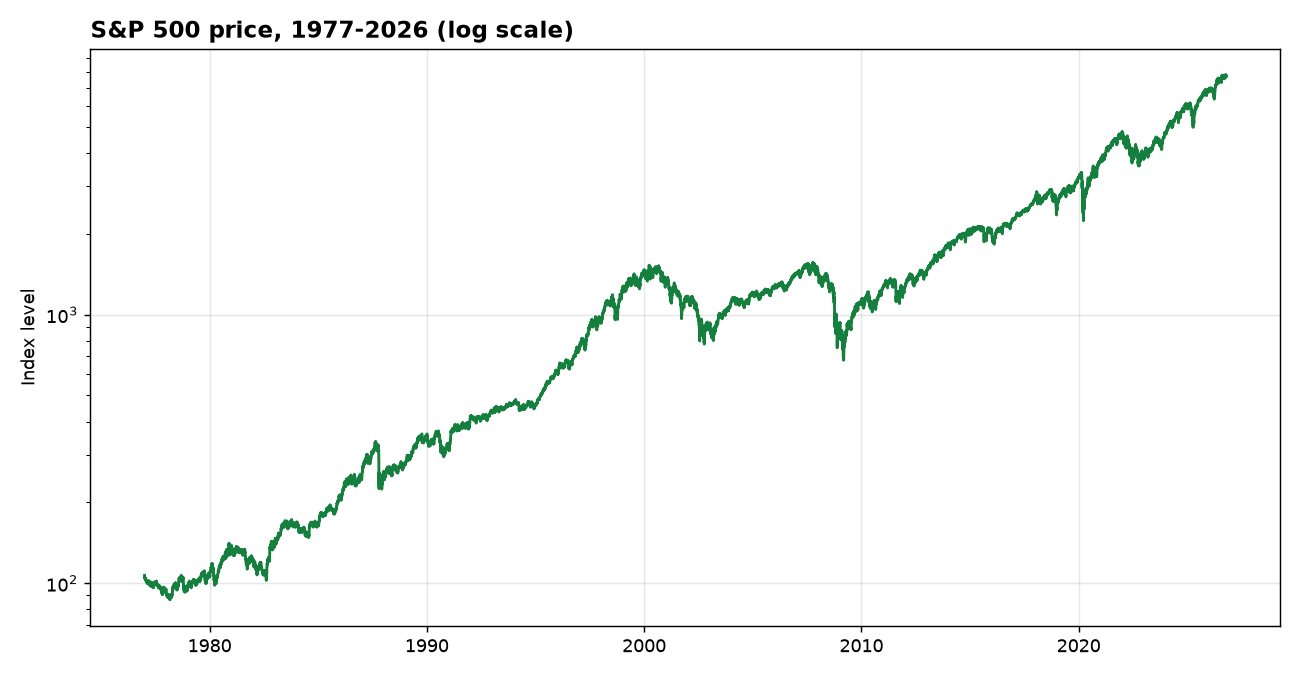
If You’d Invested $1,000 in the S&P 500 in 1977, Here’s What It Would Be Worth Today November 21, 2026 by papagong $1,000 in the S&P 500 (^GSPC) in 1977 became $260,460 by November 2026 — about 11.8% a year. Here is the decade-by-decade story, with the chart.
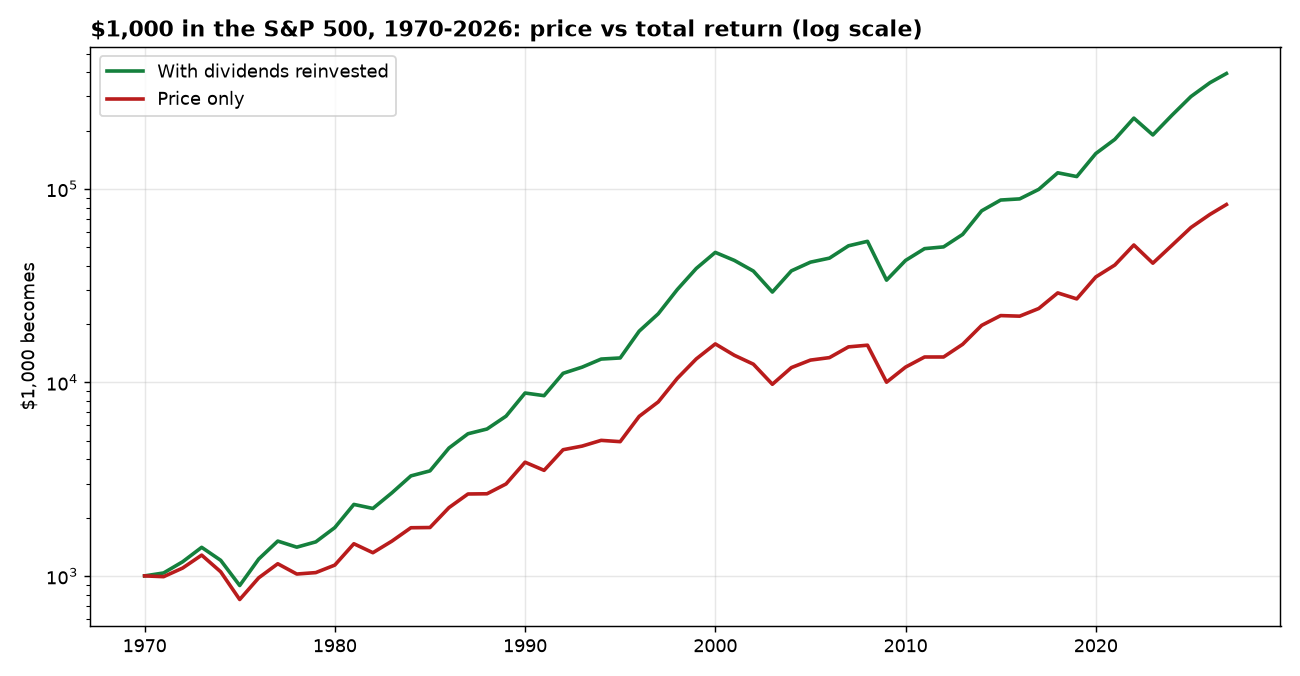
What Dividends Really Did: The $311,199 That Price Charts Never Show (1970–2026) November 21, 2026 by papagong The S&P 500 price turned $1,000 into about $82,931 since 1970. With dividends reinvested it became about $394,130. The gap is the story.
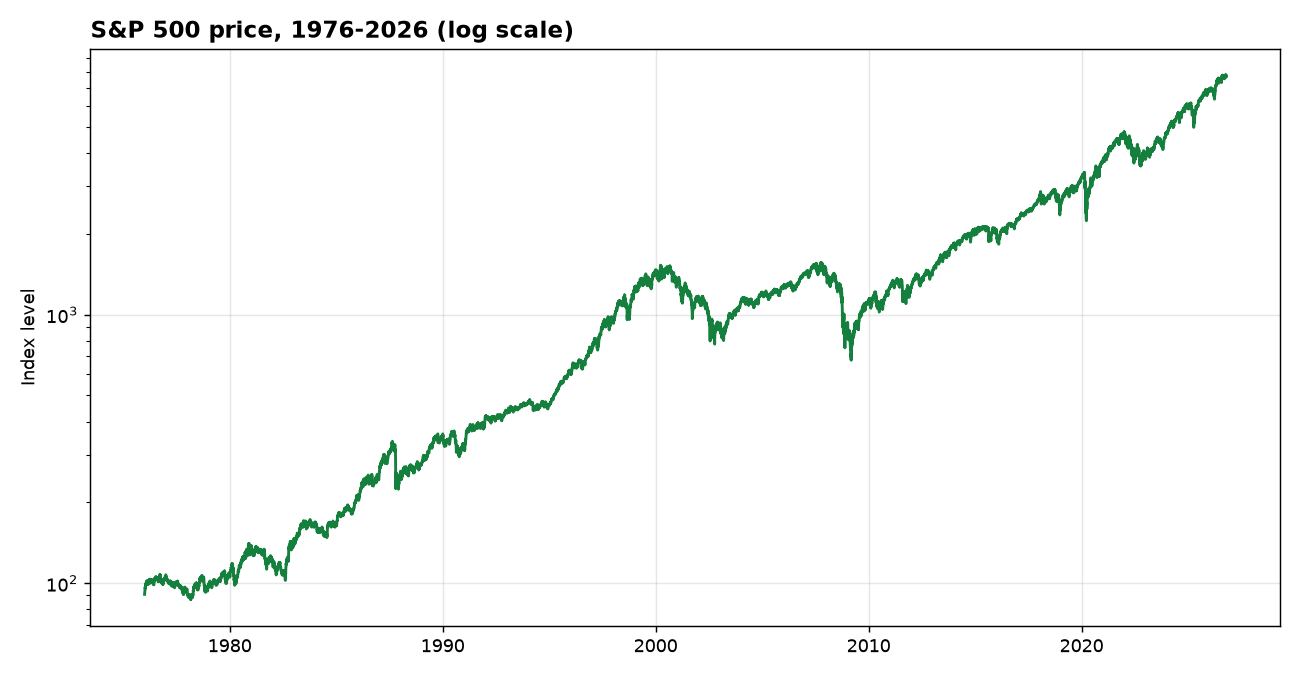
If You’d Invested $1,000 in the S&P 500 in 1976, Here’s What It Would Be Worth Today November 20, 2026 by papagong $1,000 in the S&P 500 (^GSPC) in 1976 became $322,527 by November 2026 — about 12.0% a year. Here is the decade-by-decade story, with the chart.
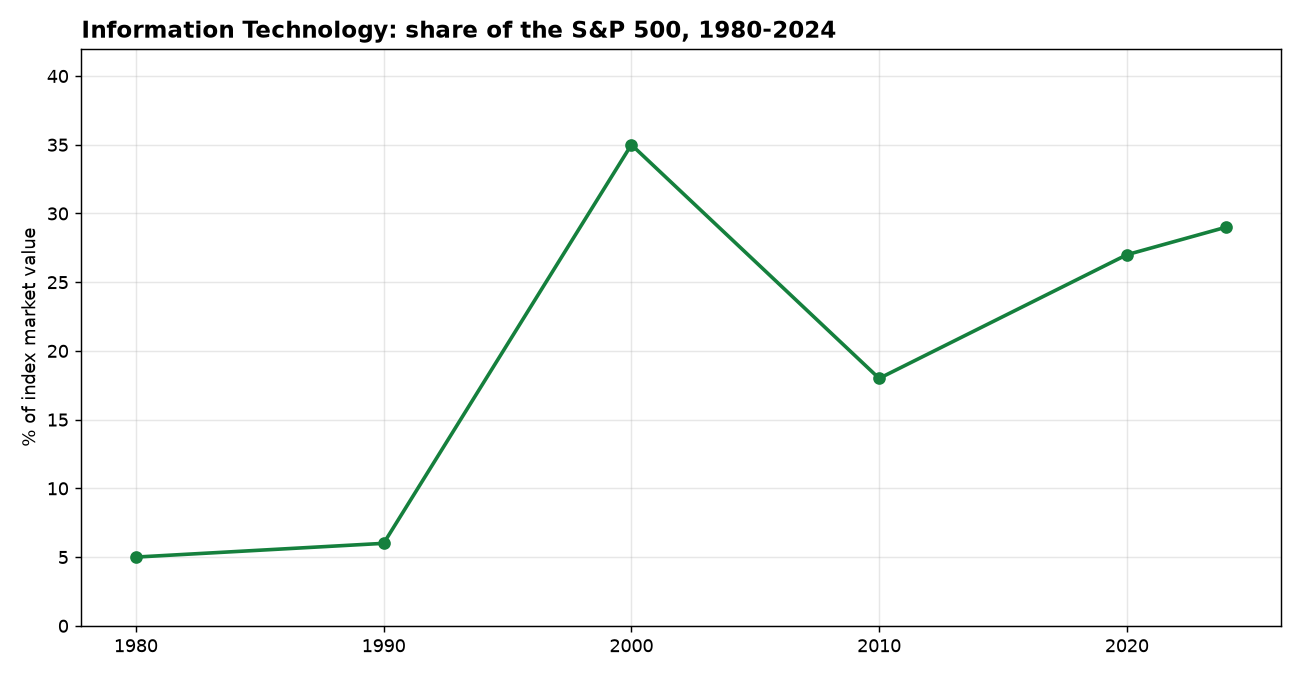
Information Technology in the S&P 500: From 5% to 29% (1980–2024) November 20, 2026 by papagong Information Technology was about 5% of the S&P 500 in 1980 and about 29% in 2024. The 44-year arc, the peak, and what it means.
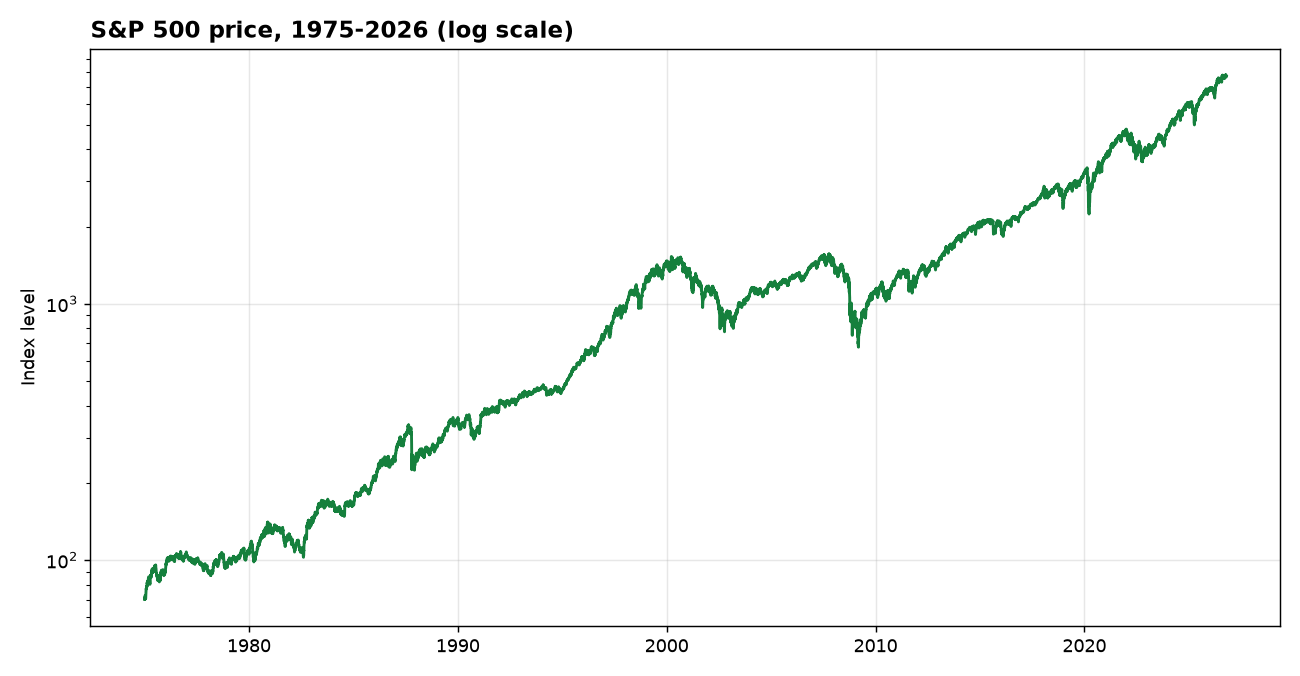
If You’d Invested $1,000 in the S&P 500 in 1975, Here’s What It Would Be Worth Today November 19, 2026 by papagong $1,000 in the S&P 500 (^GSPC) in 1975 became $441,862 by November 2026 — about 12.5% a year. Here is the decade-by-decade story, with the chart.
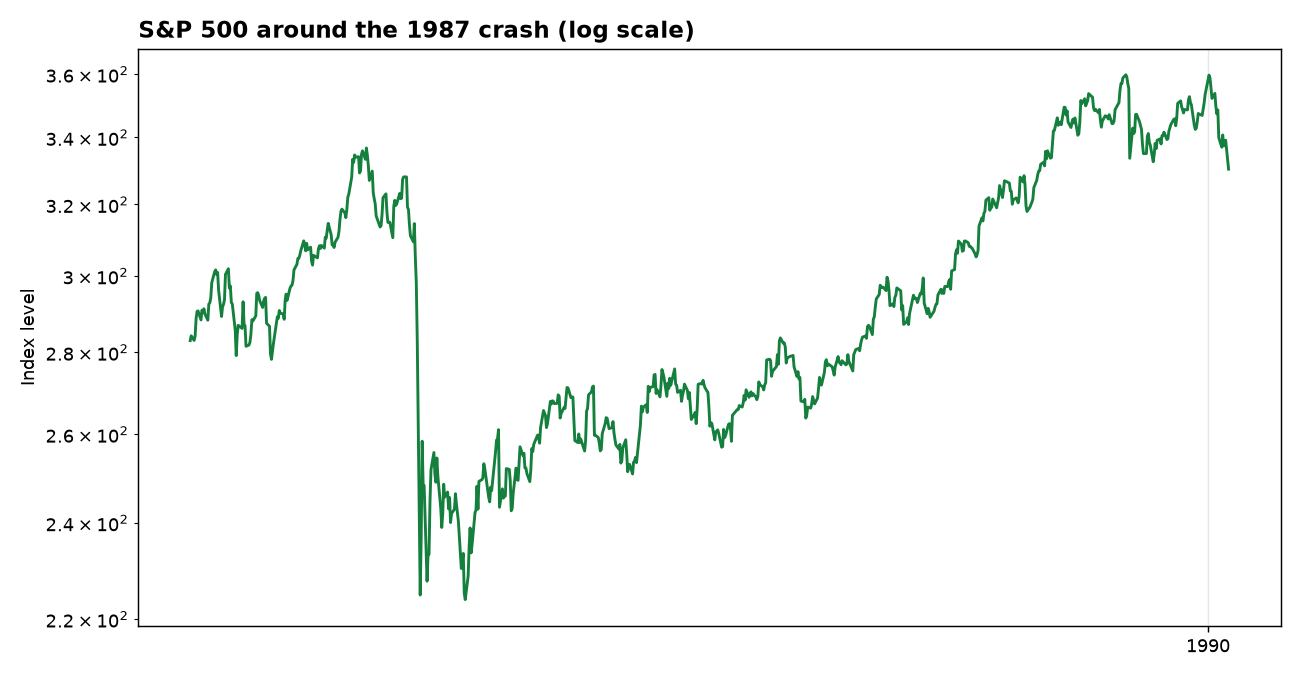
1987: Black Monday: How Far the Market Fell, and How Long It Took to Come Back November 19, 2026 by papagong The S&P 500 fell -33.5% in the 1987 crash. Here is how far it fell, and how long the way back took.
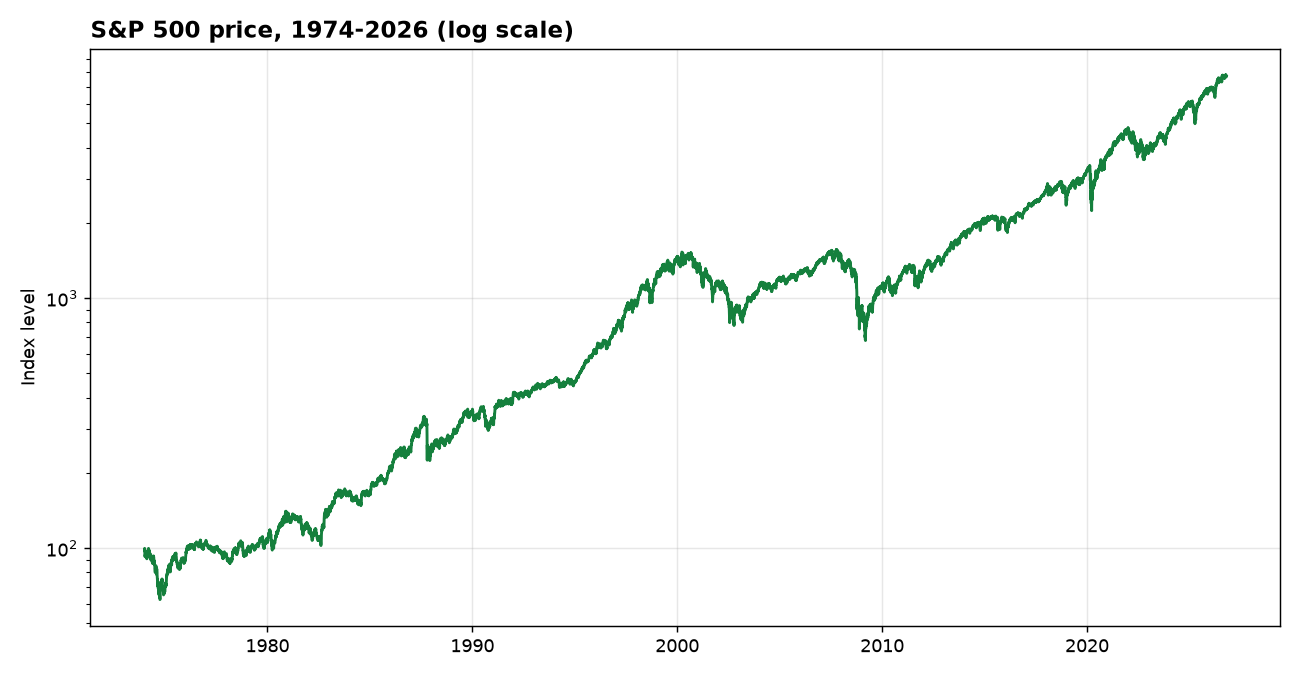
If You’d Invested $1,000 in the S&P 500 in 1974, Here’s What It Would Be Worth Today November 18, 2026 by papagong $1,000 in the S&P 500 (^GSPC) in 1974 became $327,420 by November 2026 — about 11.6% a year. Here is the decade-by-decade story, with the chart.
NVIDIA (NVDA): 27 Years of Stock Market History in One Chart November 18, 2026 by papagong NVIDIA (NVDA) is the chipmaker that went from video games to the center of the AI boom. 27 years of price history, the worst crash, and the decade-by-decade story.
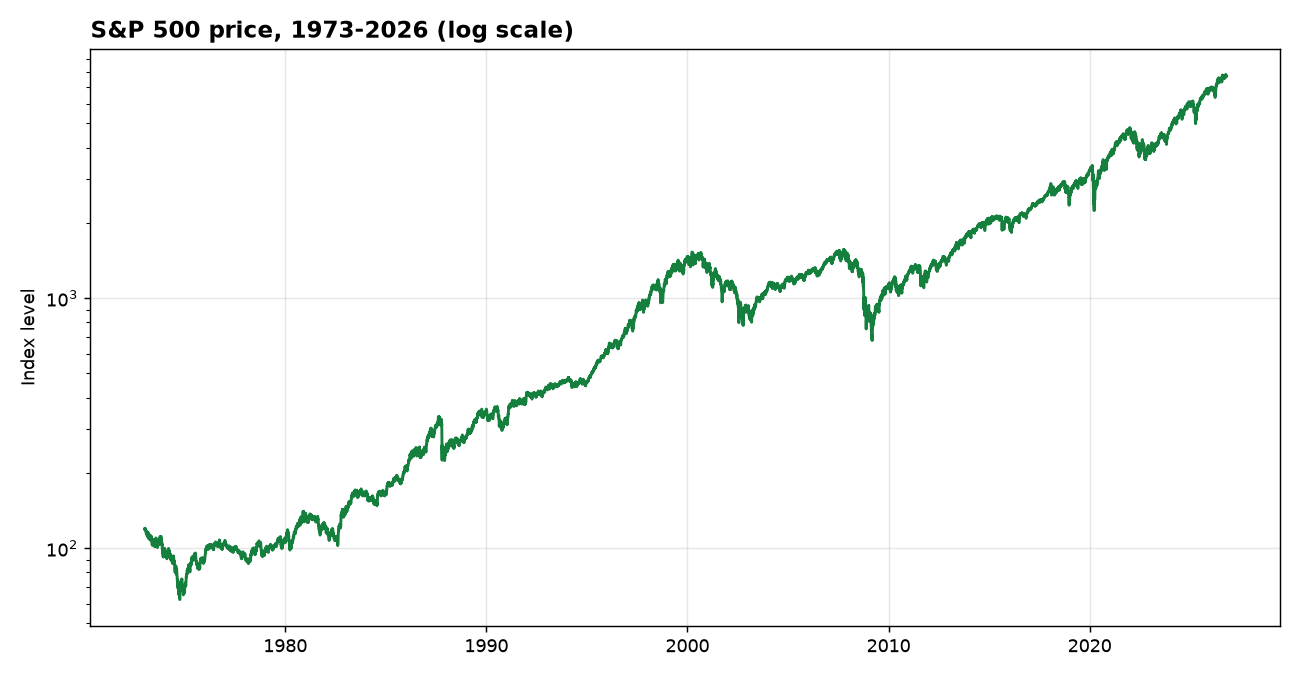
If You’d Invested $1,000 in the S&P 500 in 1973, Here’s What It Would Be Worth Today November 17, 2026 by papagong $1,000 in the S&P 500 (^GSPC) in 1973 became $280,566 by November 2026 — about 11.0% a year. Here is the decade-by-decade story, with the chart.